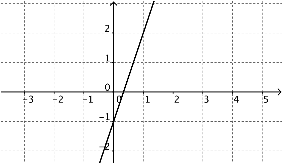
Graphing Lines
We could be given the equation in a variety of ways: y-intercept, standard form and point slope.
y-intercept: ![]()
The slope can be easily identified as 3 and the y-intercept is (0, -1).

standard: ![]()
We plug in 0 for x and 0 for y and can find the points (0, -4) and (3, 0).

Remember how to graph anything else? Parabolas, or circles maybe?